Introduction
Last November, I participated in the 30DayMapChallenge. I learned a lot by making different maps with R and discovering some of the cool packages that are around for spatial data.
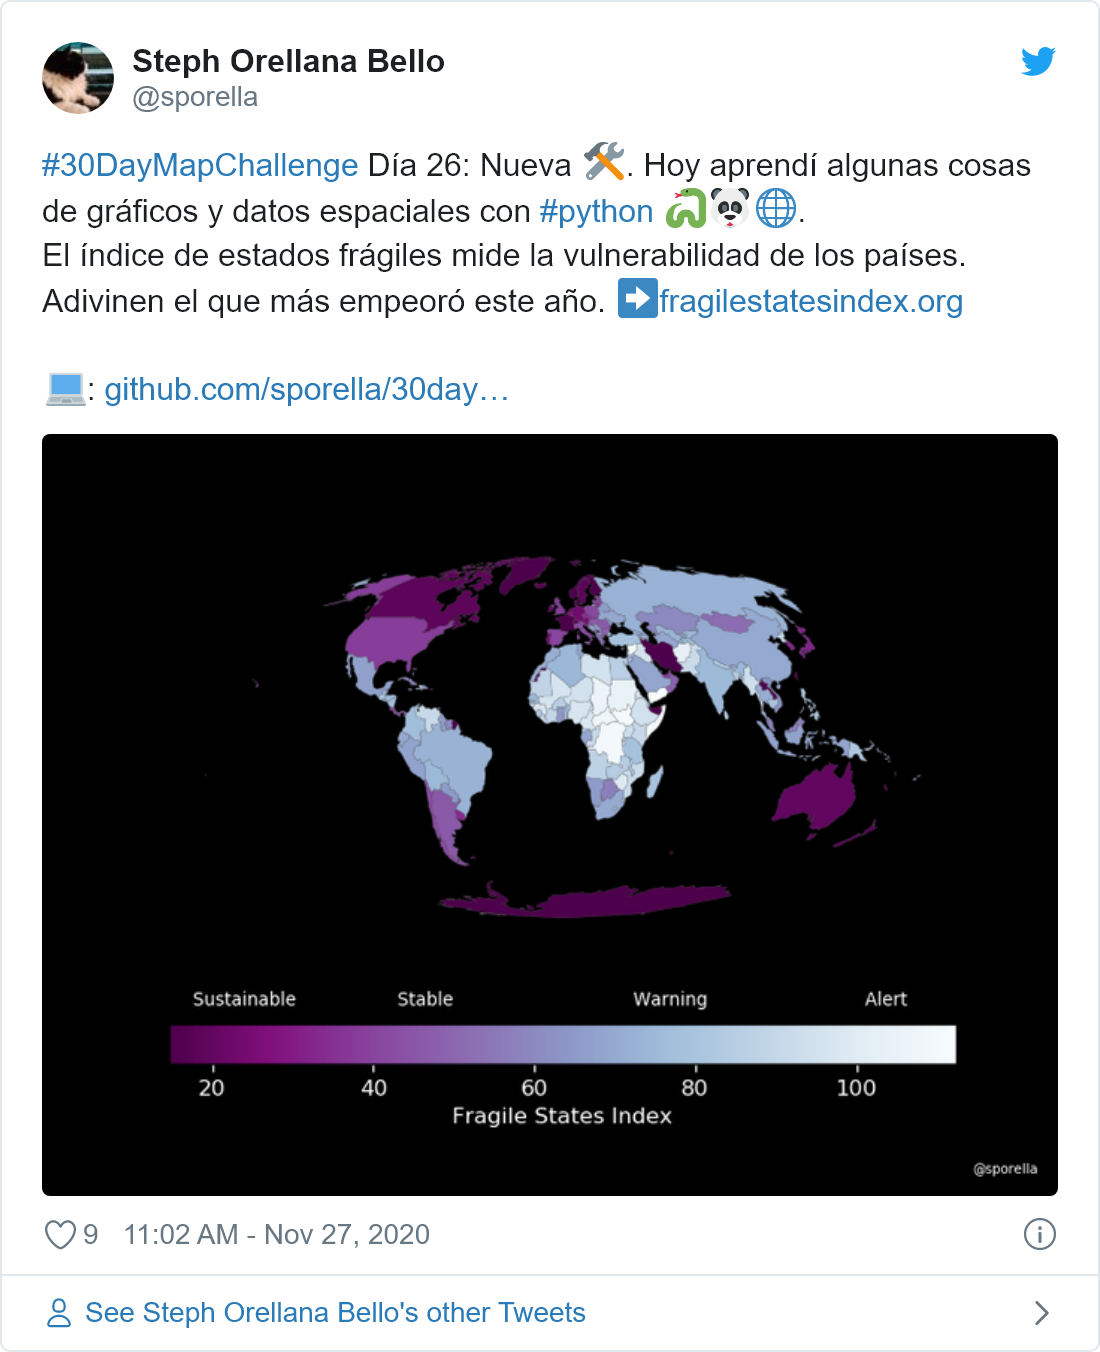
But I also learned a ton by looking at other’s results. One example is @sporella’s contribution for Day 25. She worked with a very interesting dataset called The Fragile State Index and provided the link to their website. So I added it to my list of “datasets I want to explore sometime in the future”.
The time has come and I had time to expore the Fragile State Index. For some visualizations I wanted to allow user input, so I wrote a very similar article on shinyapps. In this blogpost I am just showing the static visuals.
The Fragile State Index
The Fragile State Index is a project dedicated to measure risk and vulnerability in countries worldwide. It is powered by The Fund For Peace and the data is publicly available.
It assigns a value between 1 and 10 to each country in each one of 12 categories:
- Cohesion indicators
- Security Apparatus
- Factionalized Elites
- Group Grievance
- Economic indicators
- Economy
- Economic Inequality
- Human Flight and Brain Drain
- Political indicators
- State Legitimacy
- Public Services
- Human Rights and Rule of Law
- Social indicators
- Demographic Pressures
- Refugees and IDPs
- External Intervention
Behind each indicator many questions are asked for each country. A detailed description of the indicators can be found here. It is recommended to read through the texts before analyzing the data.
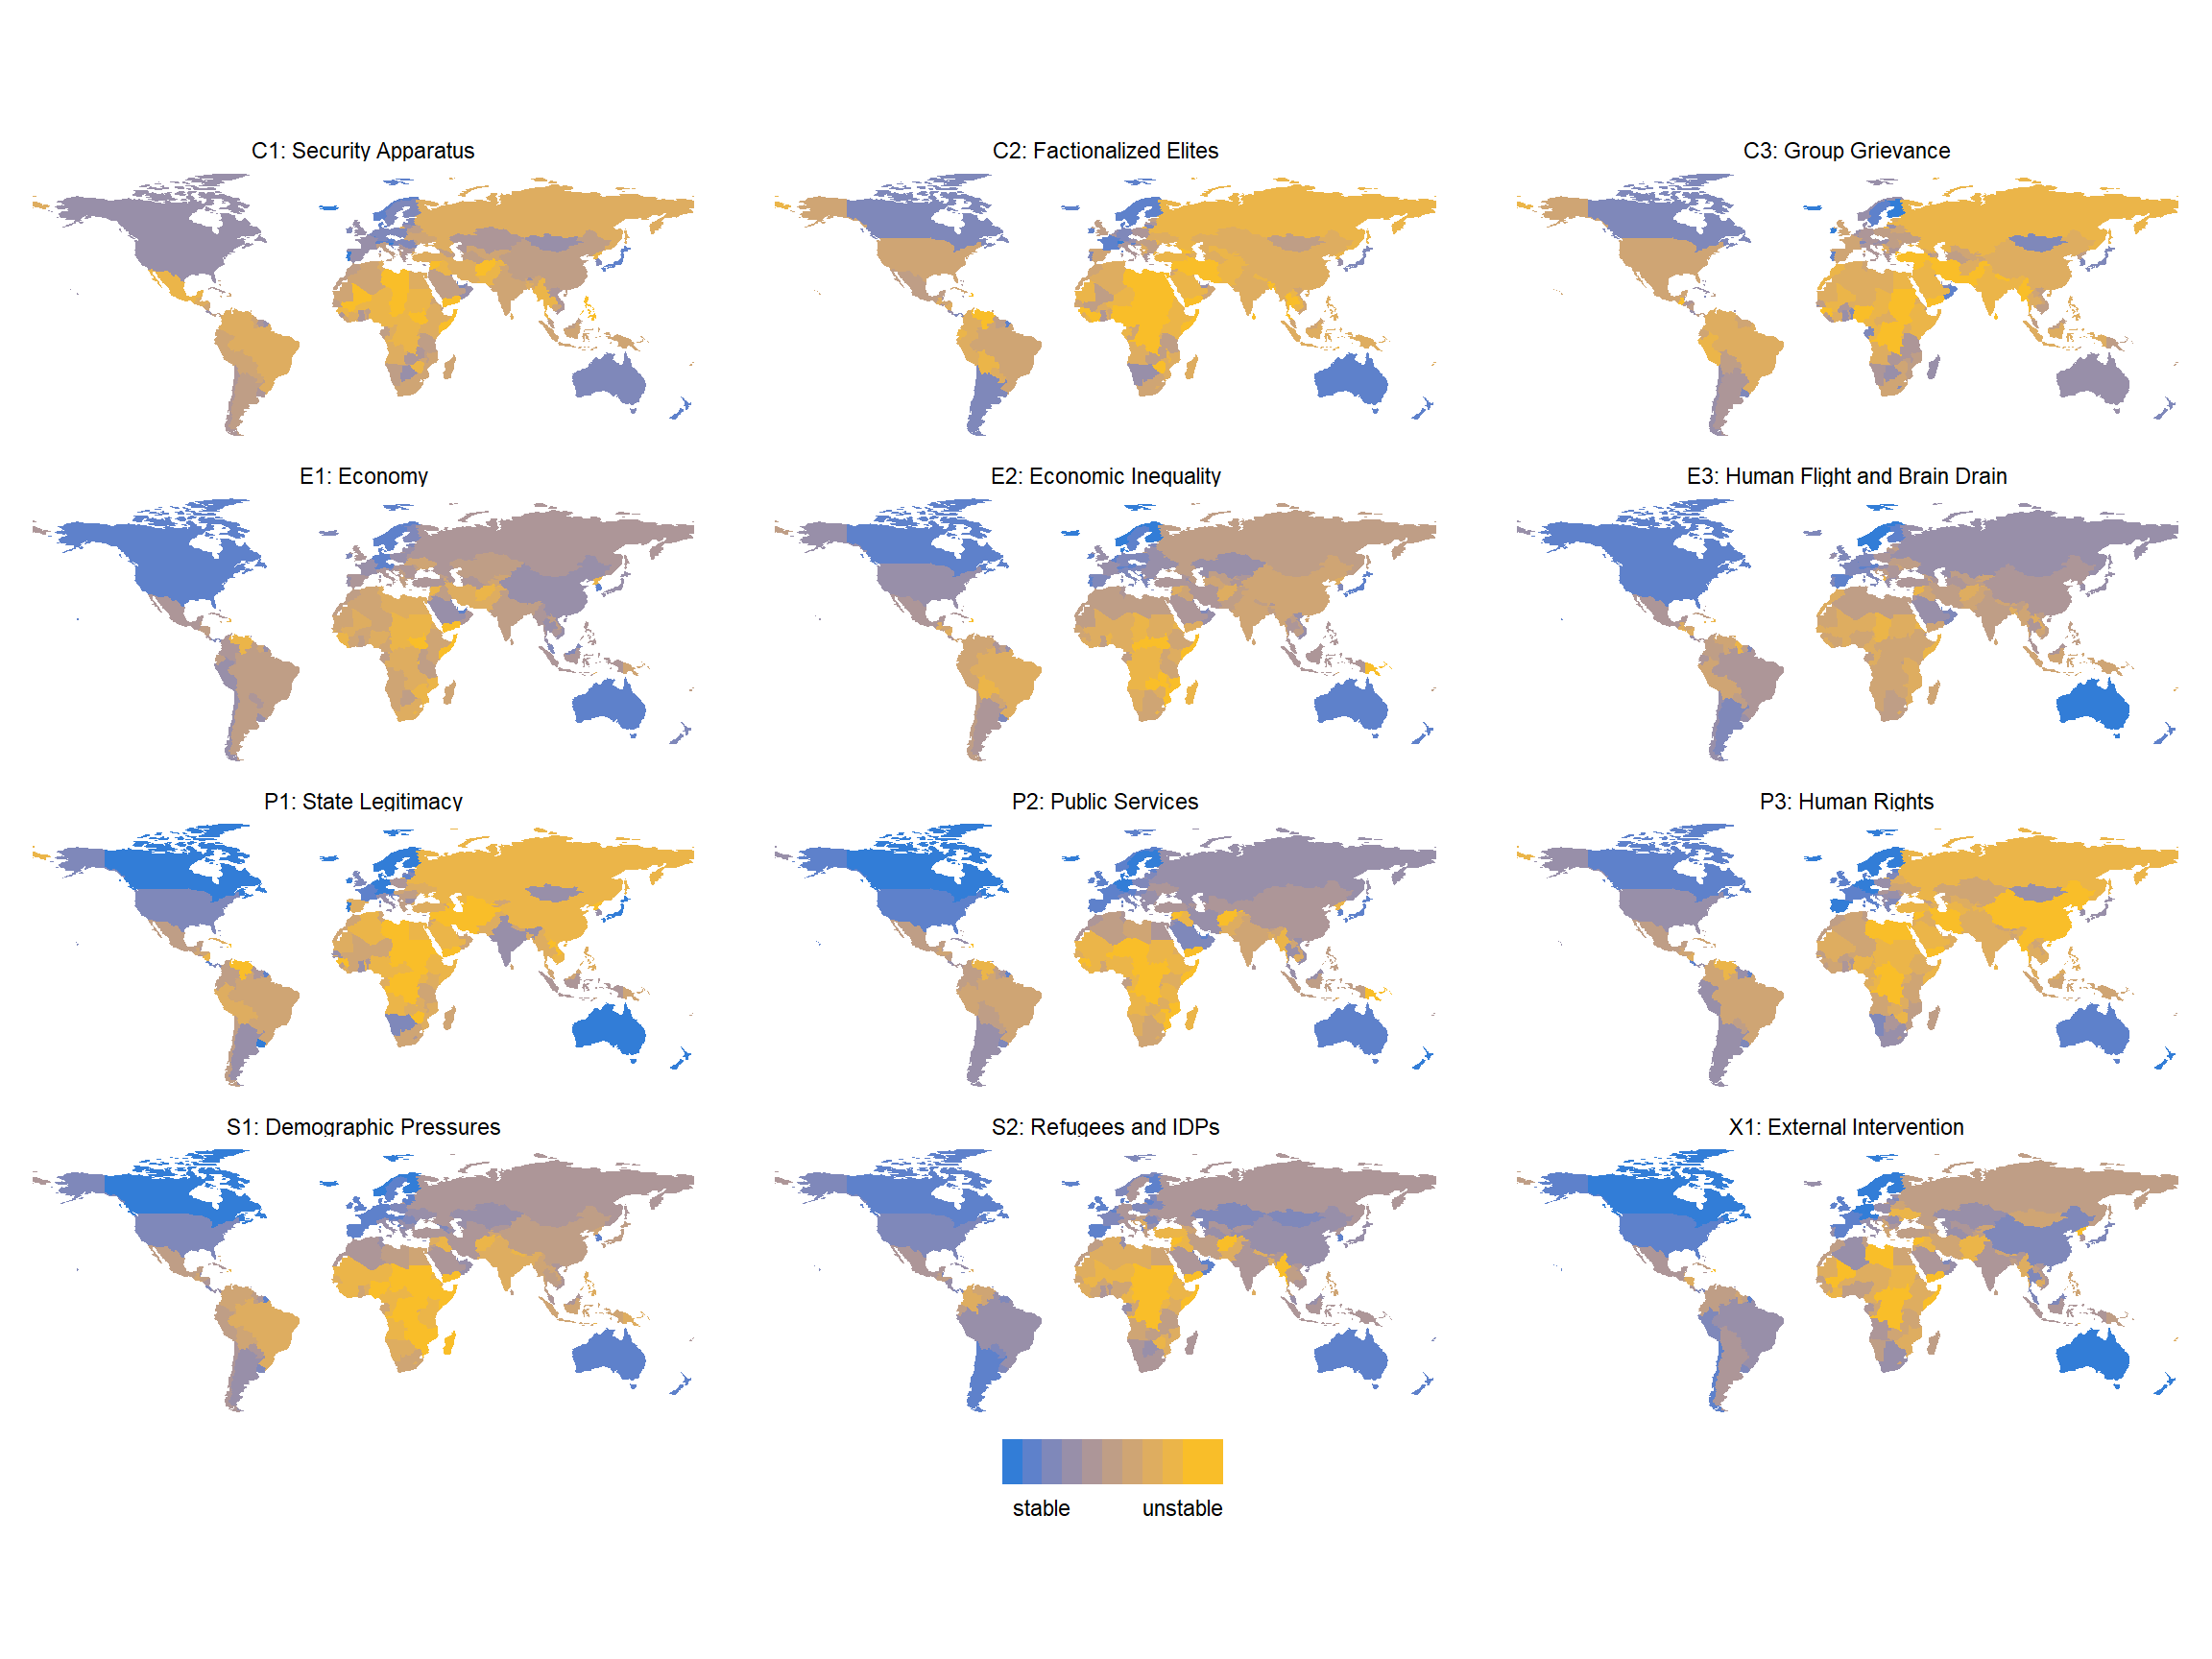
The world map
Plotting a world map does not show a lot of detail but it helps us to understand general trends. The vulnerability of countries worldwide is provoked by different factors in different countries. We will go into more detail in the next sections, but this helps to get a general overview.
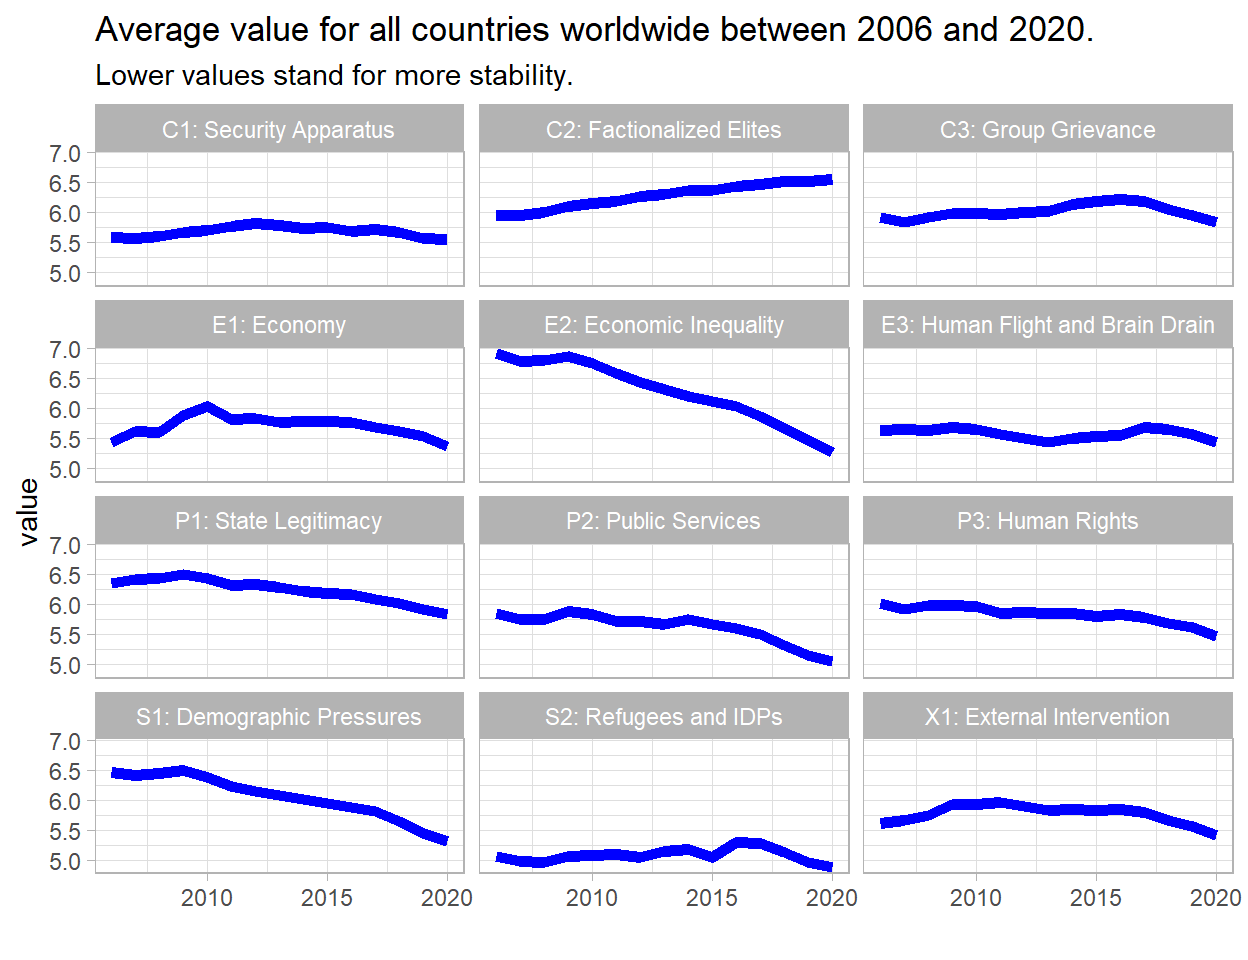
The long-term trend
It is interesting to look at long-term trends and see in which indicators countries improved / worsened between 2006 and 2020. Note, that a lower value means higher stability.
Looking at the worldwide average, we can see that most categories have improved slightly. Large improvements have been made in Economic Inequality and Demographic Pressures, while Factionalized Elites have made countries on average more unstable.
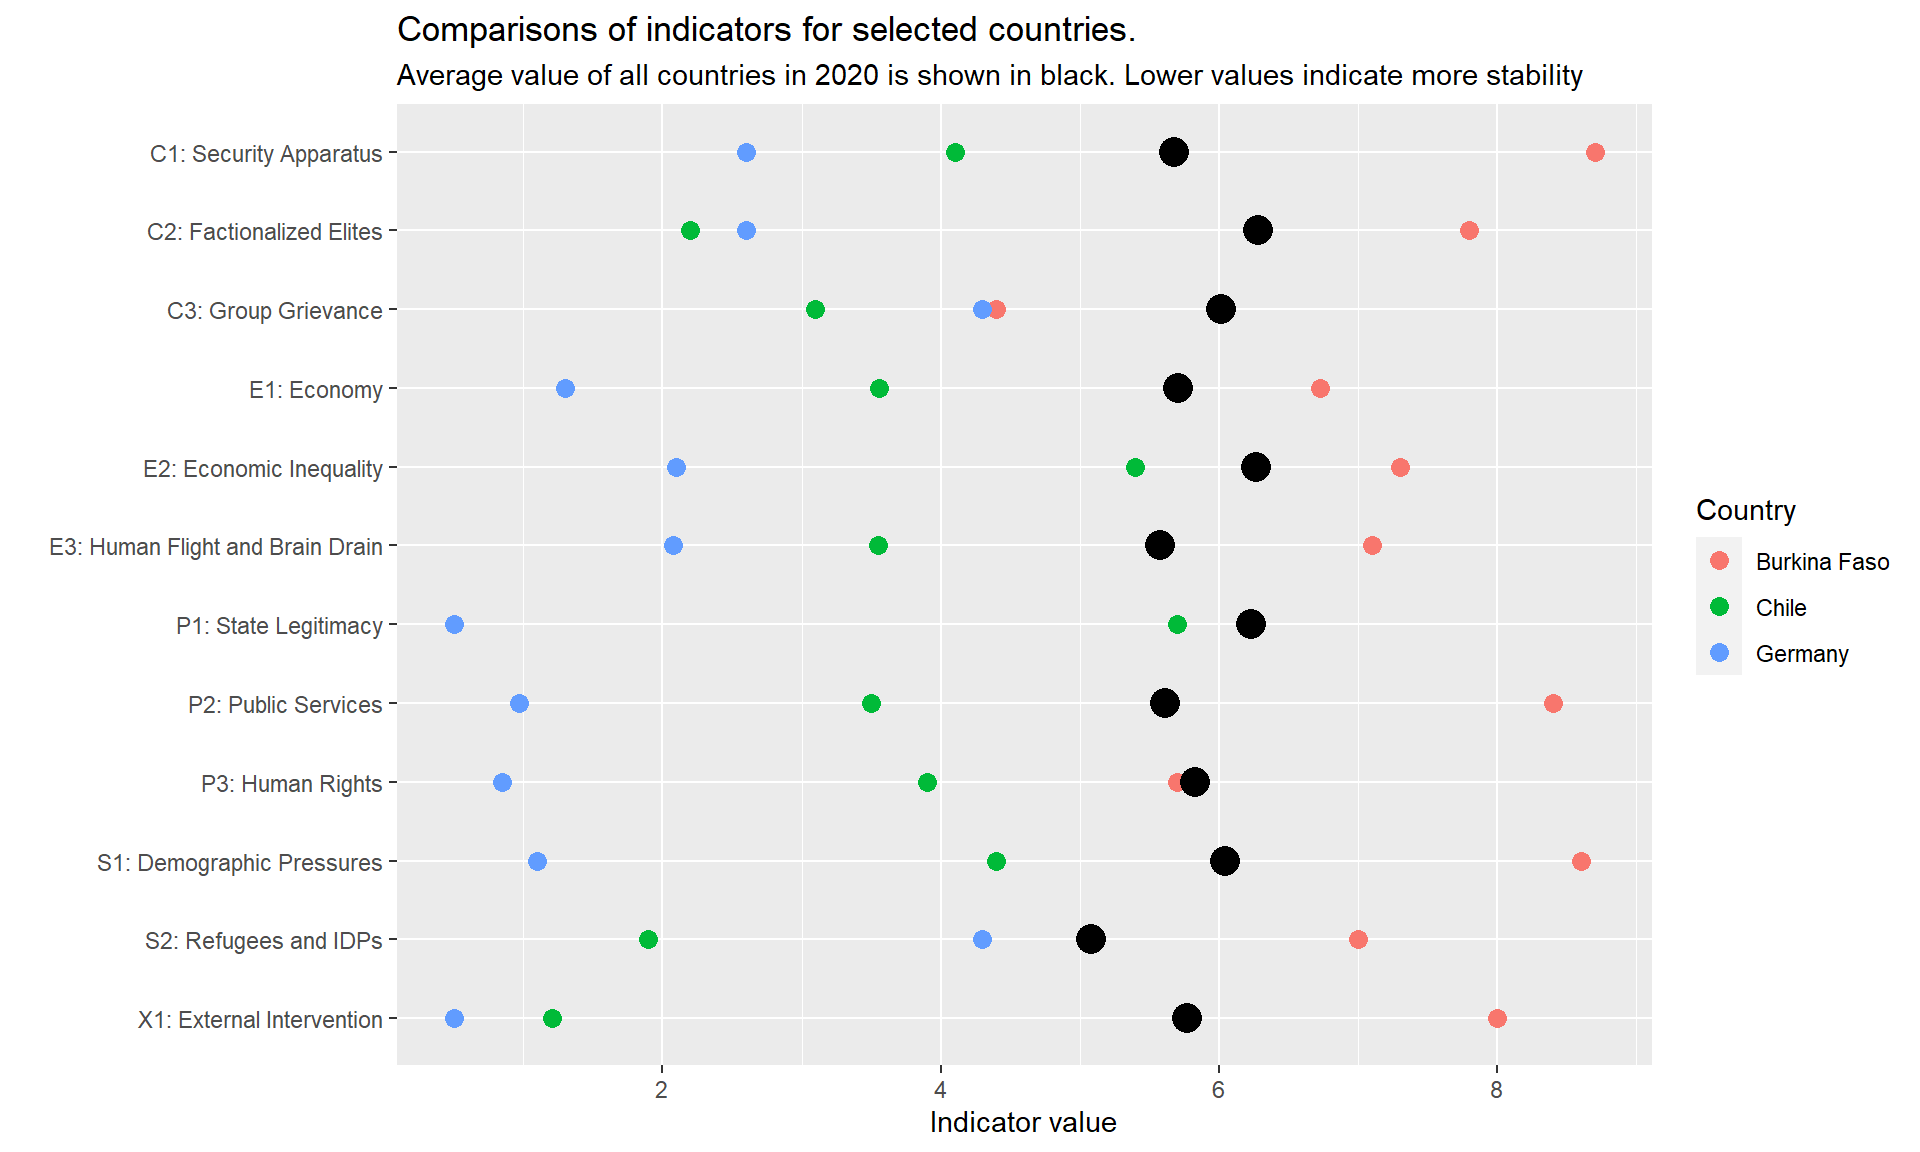
First comparison between countries
After looking at the world map we got a first intuition of the indicators. However, if we want to compare selected countries, it is easier to compare the exact values for 2020 in these countries with the average value for all countries.
I try to read this as follows: Country X is doing good in Indicators I and J, but is not yet doing good in Indicator K.
In the interactive version, users can also see the last years to compare how a certain country has changed compared to itself.

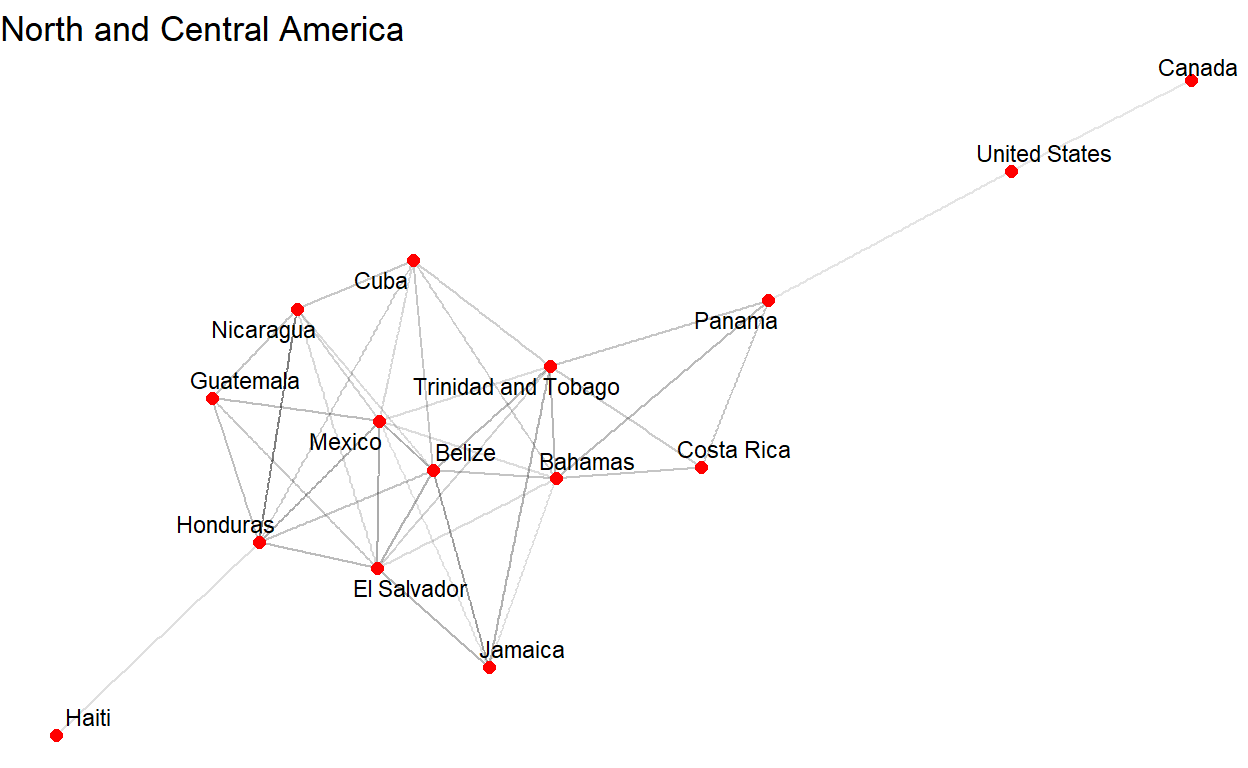
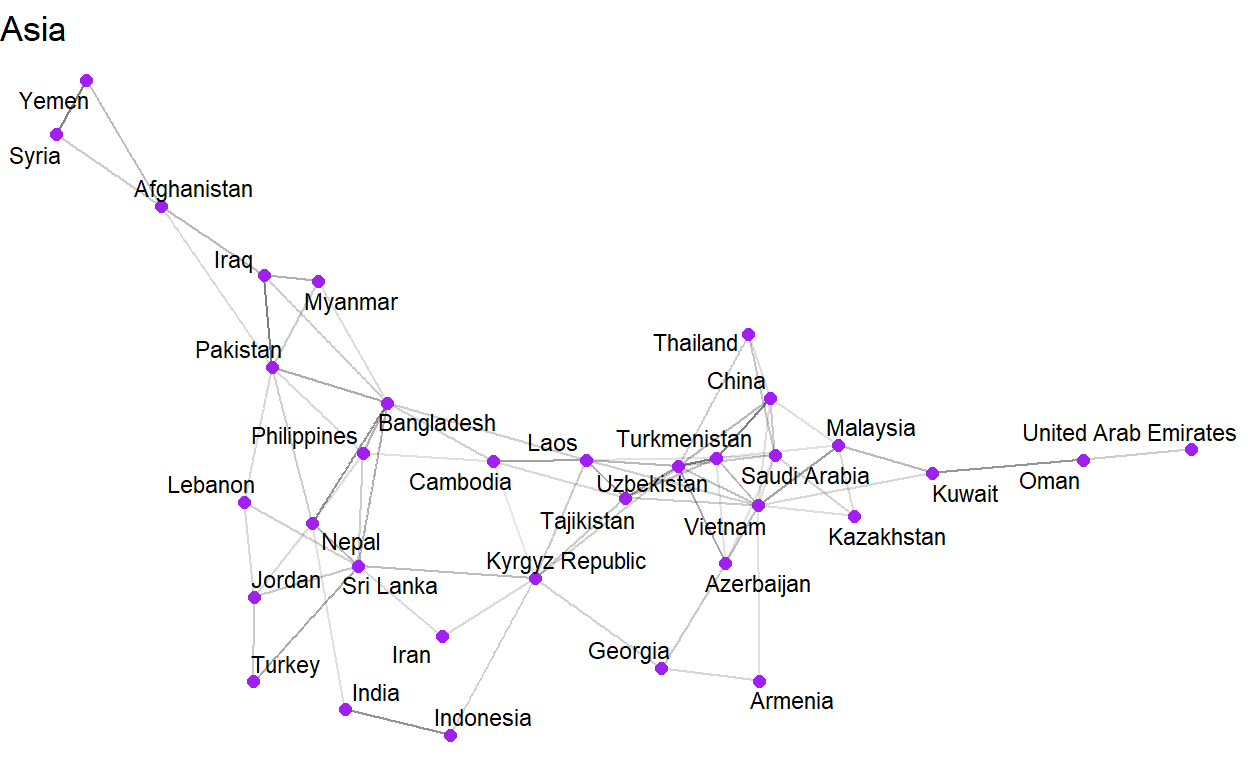
Network graph
A network graph can help to see connections between countries who have similar indicator values. We use the 2020 values for comparing two countries and draw lines between them if they are similar. The relative position of a country in the network does not have a meaning, it is self-arranging depending on the number of connections.
In the interactive version you can brush a rectangle with your mouse over countries of interest to see their historical details.
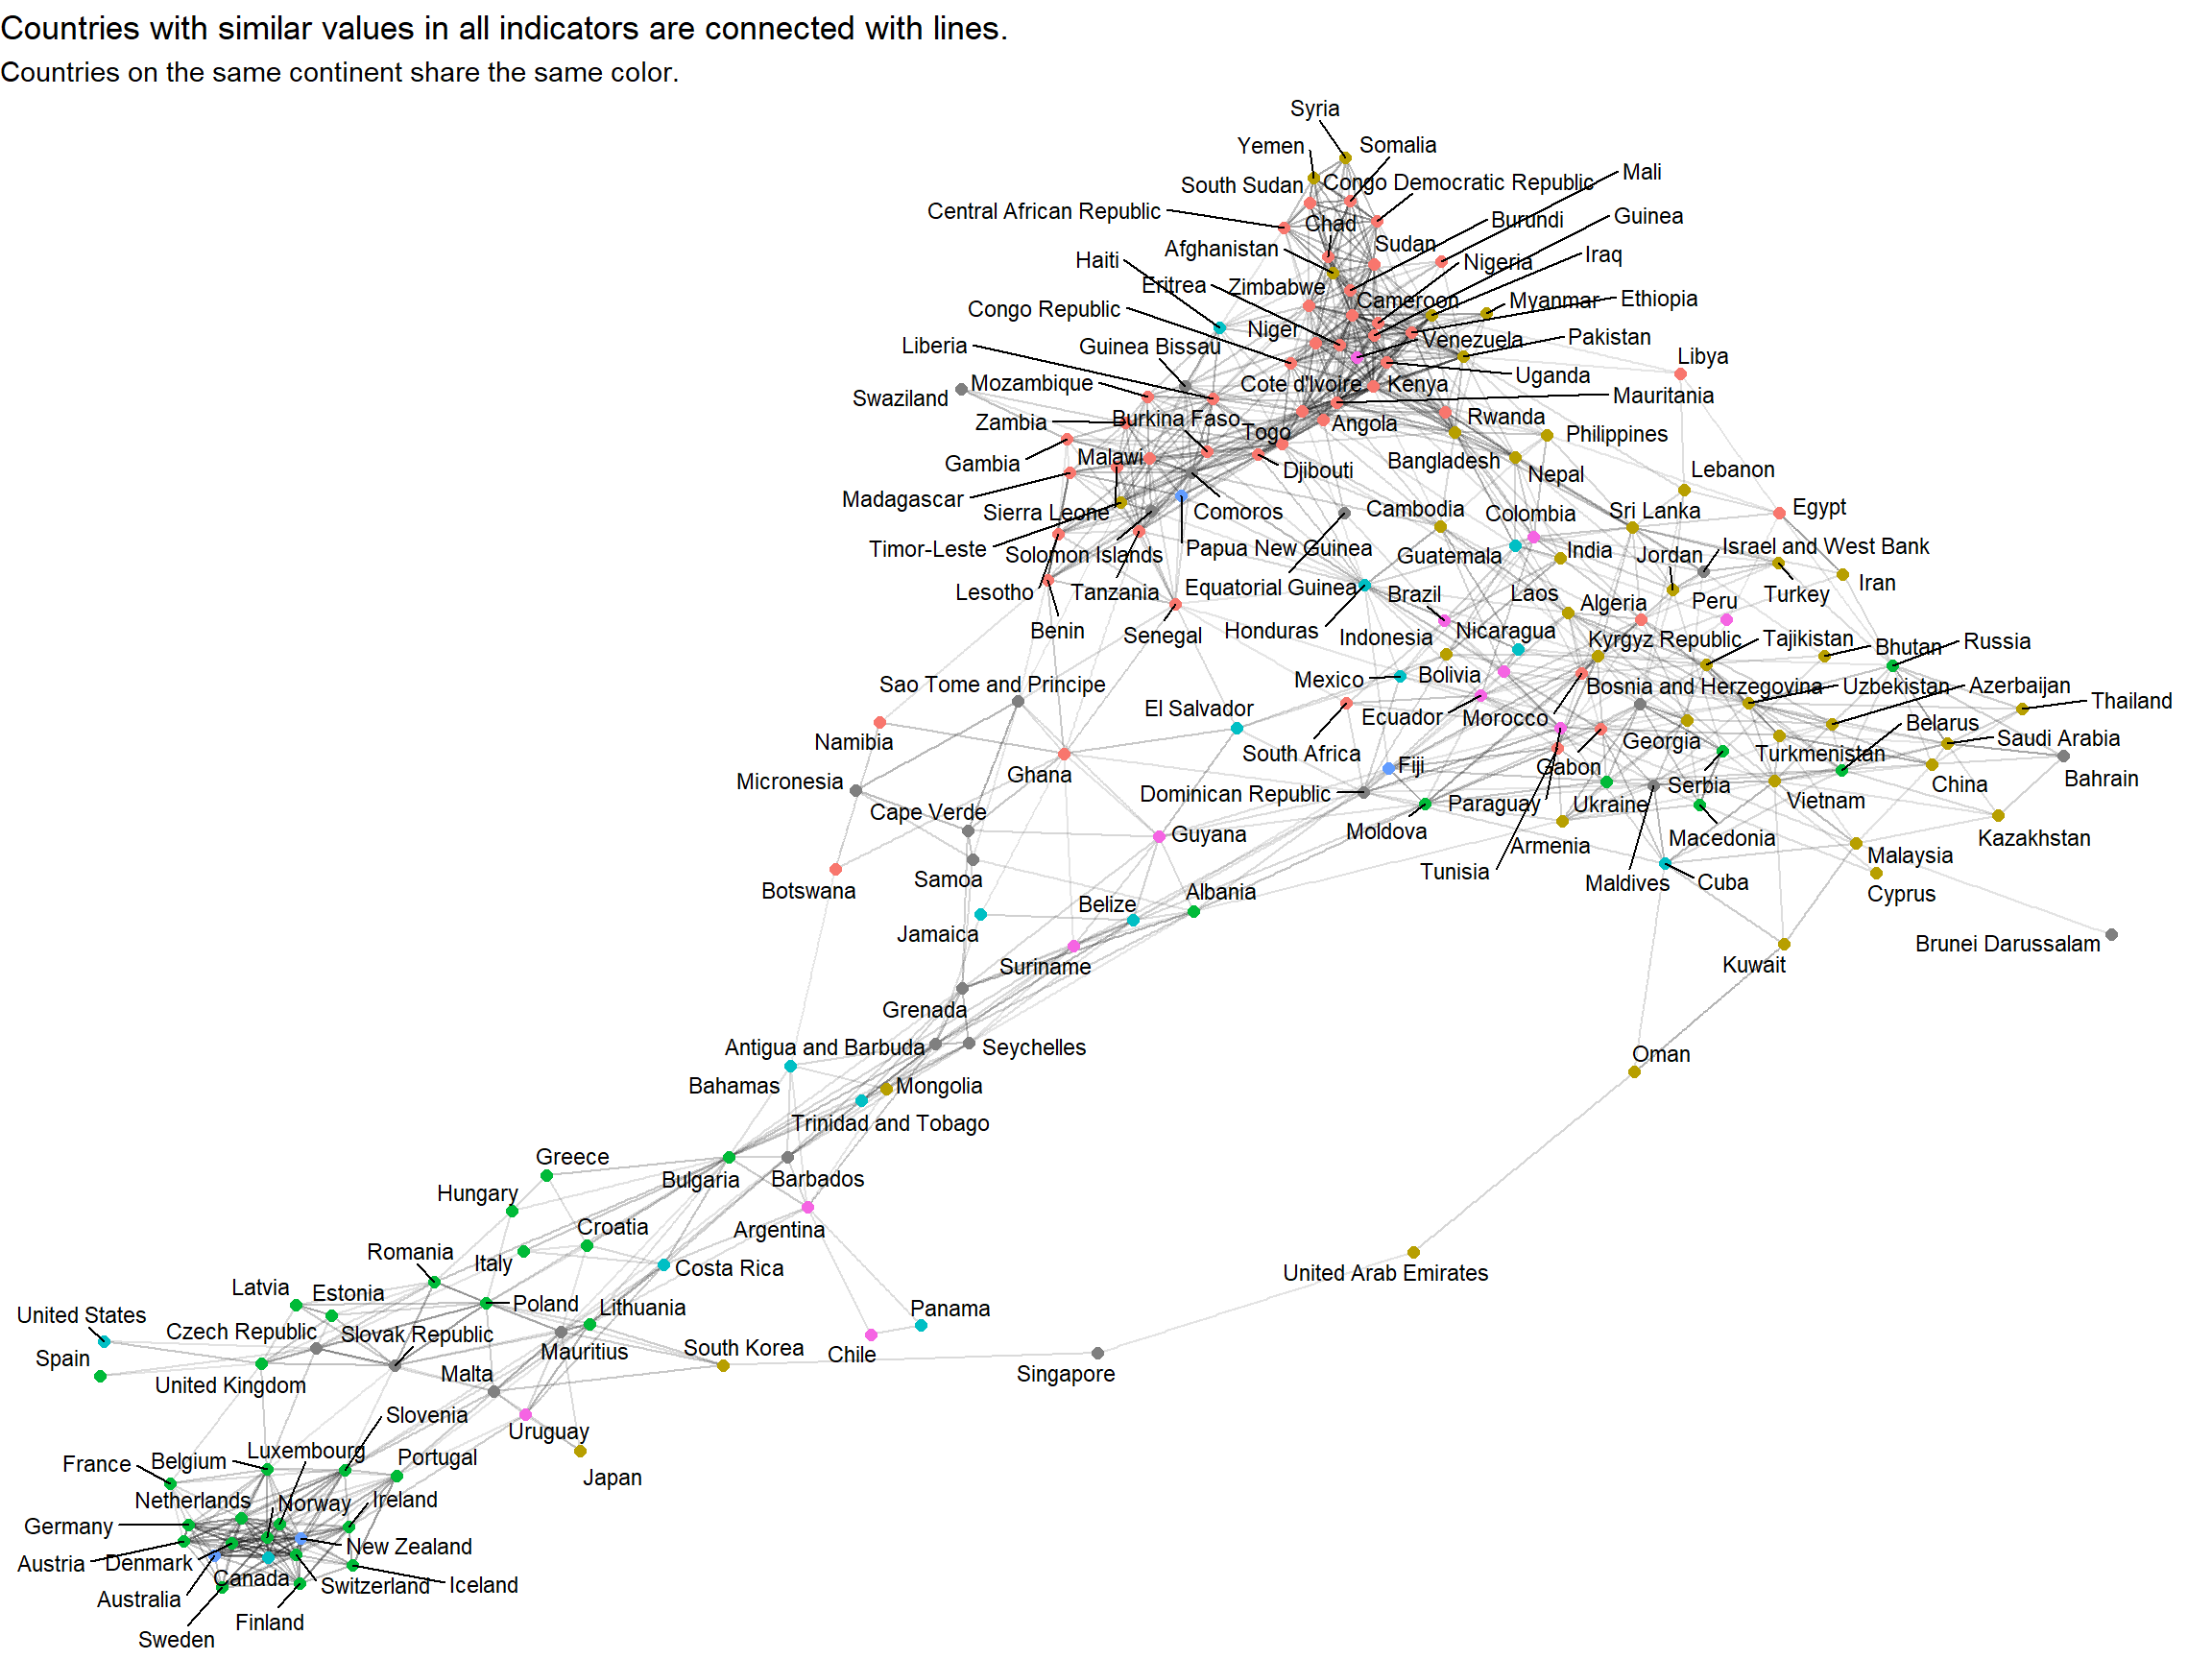
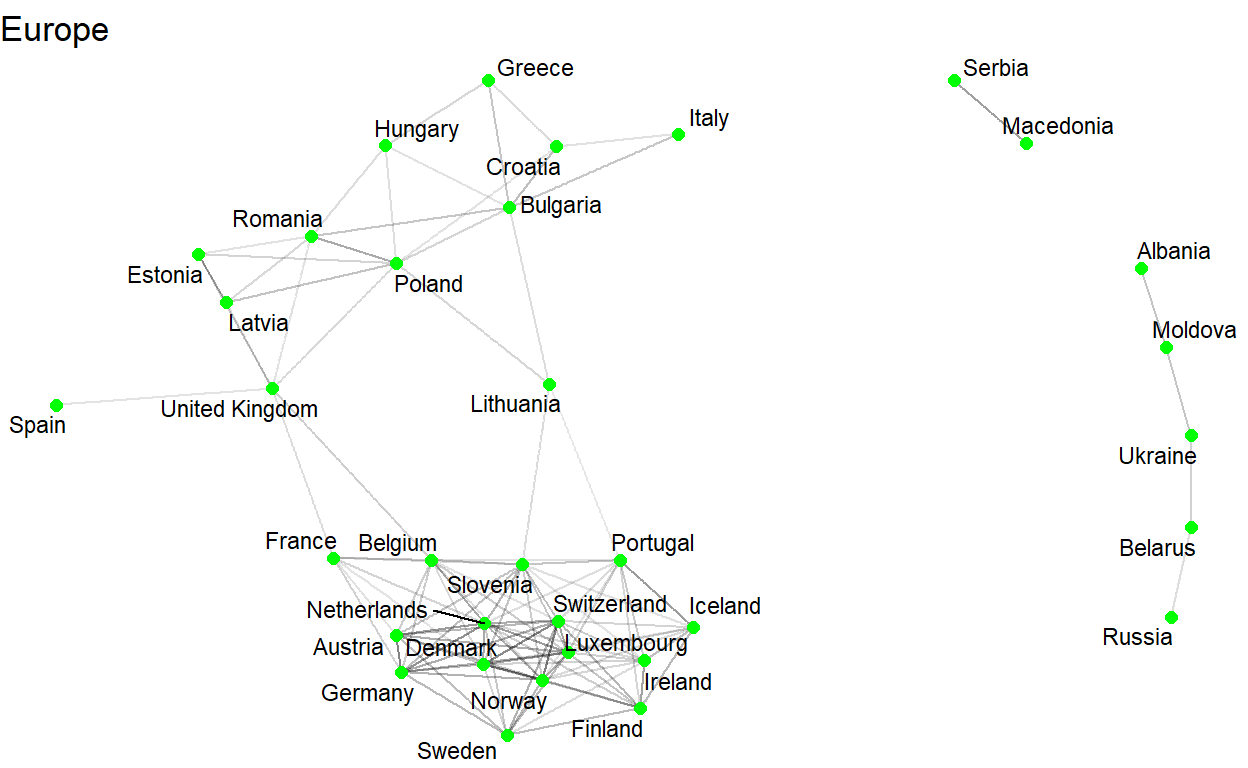
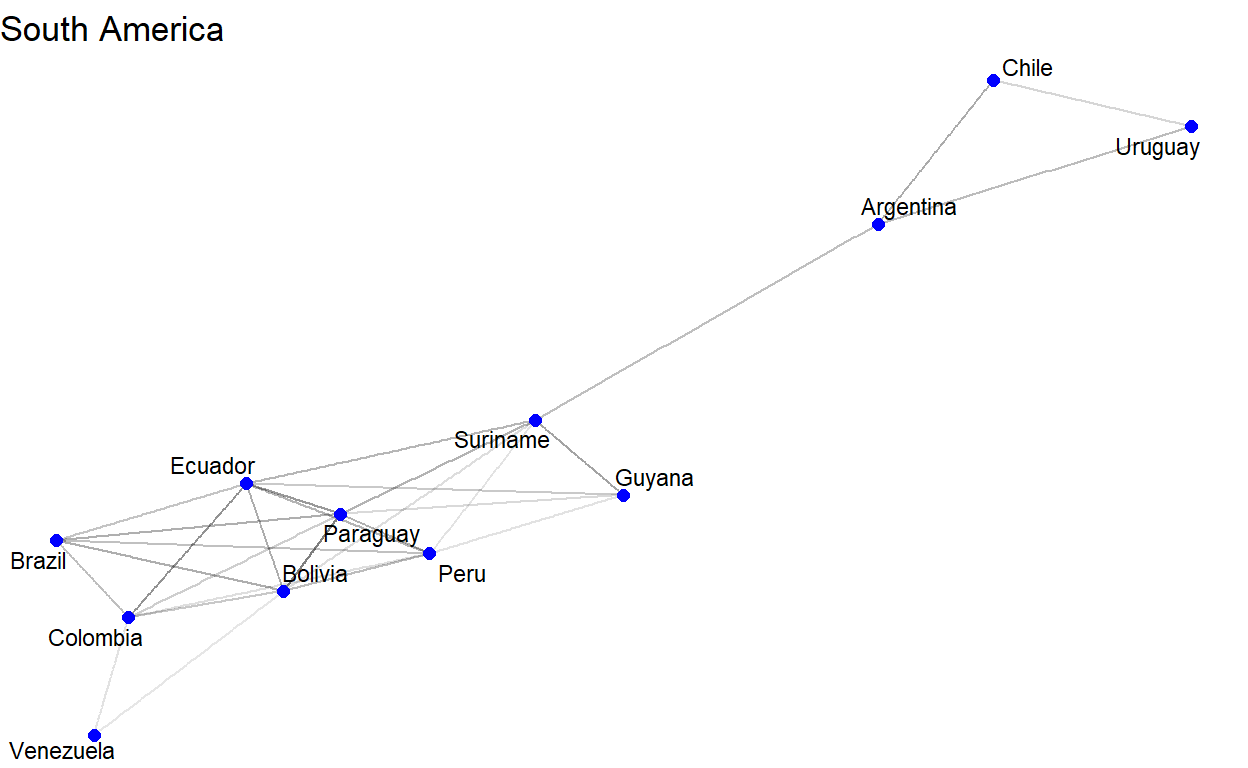
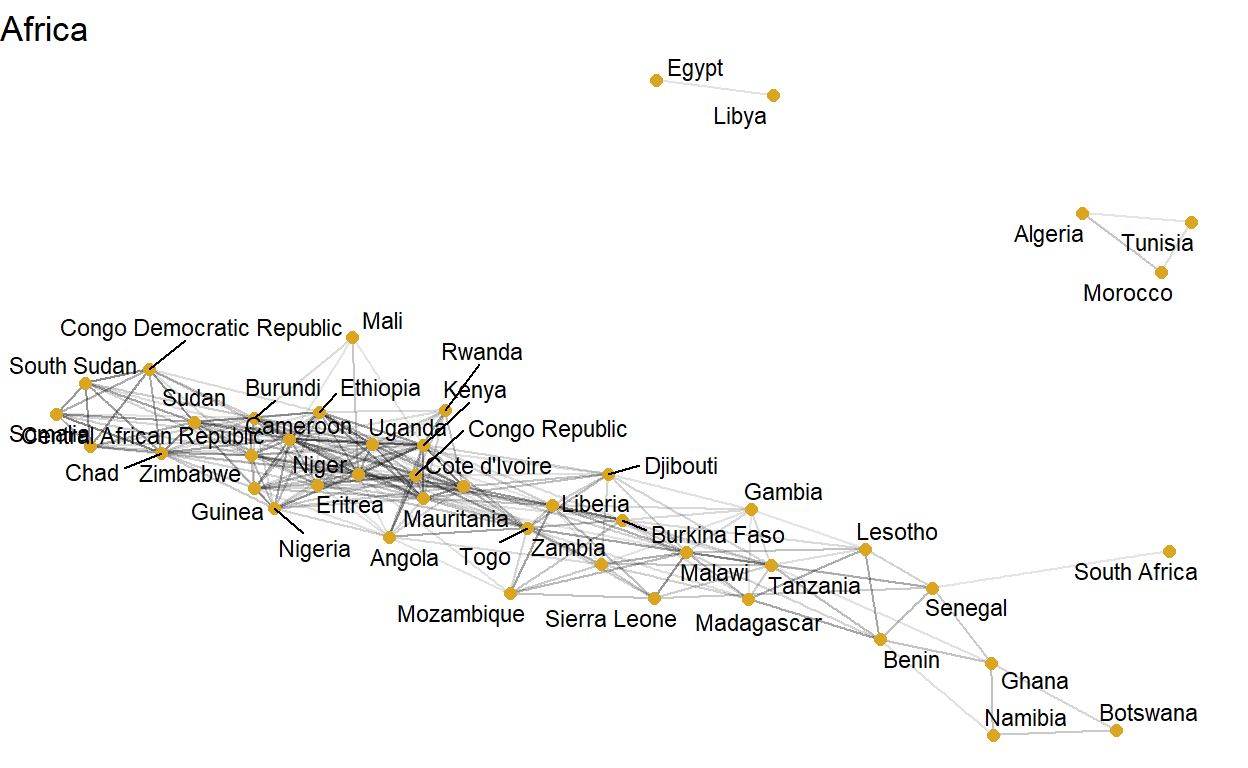
To get a better view, we can look at some continents separately.
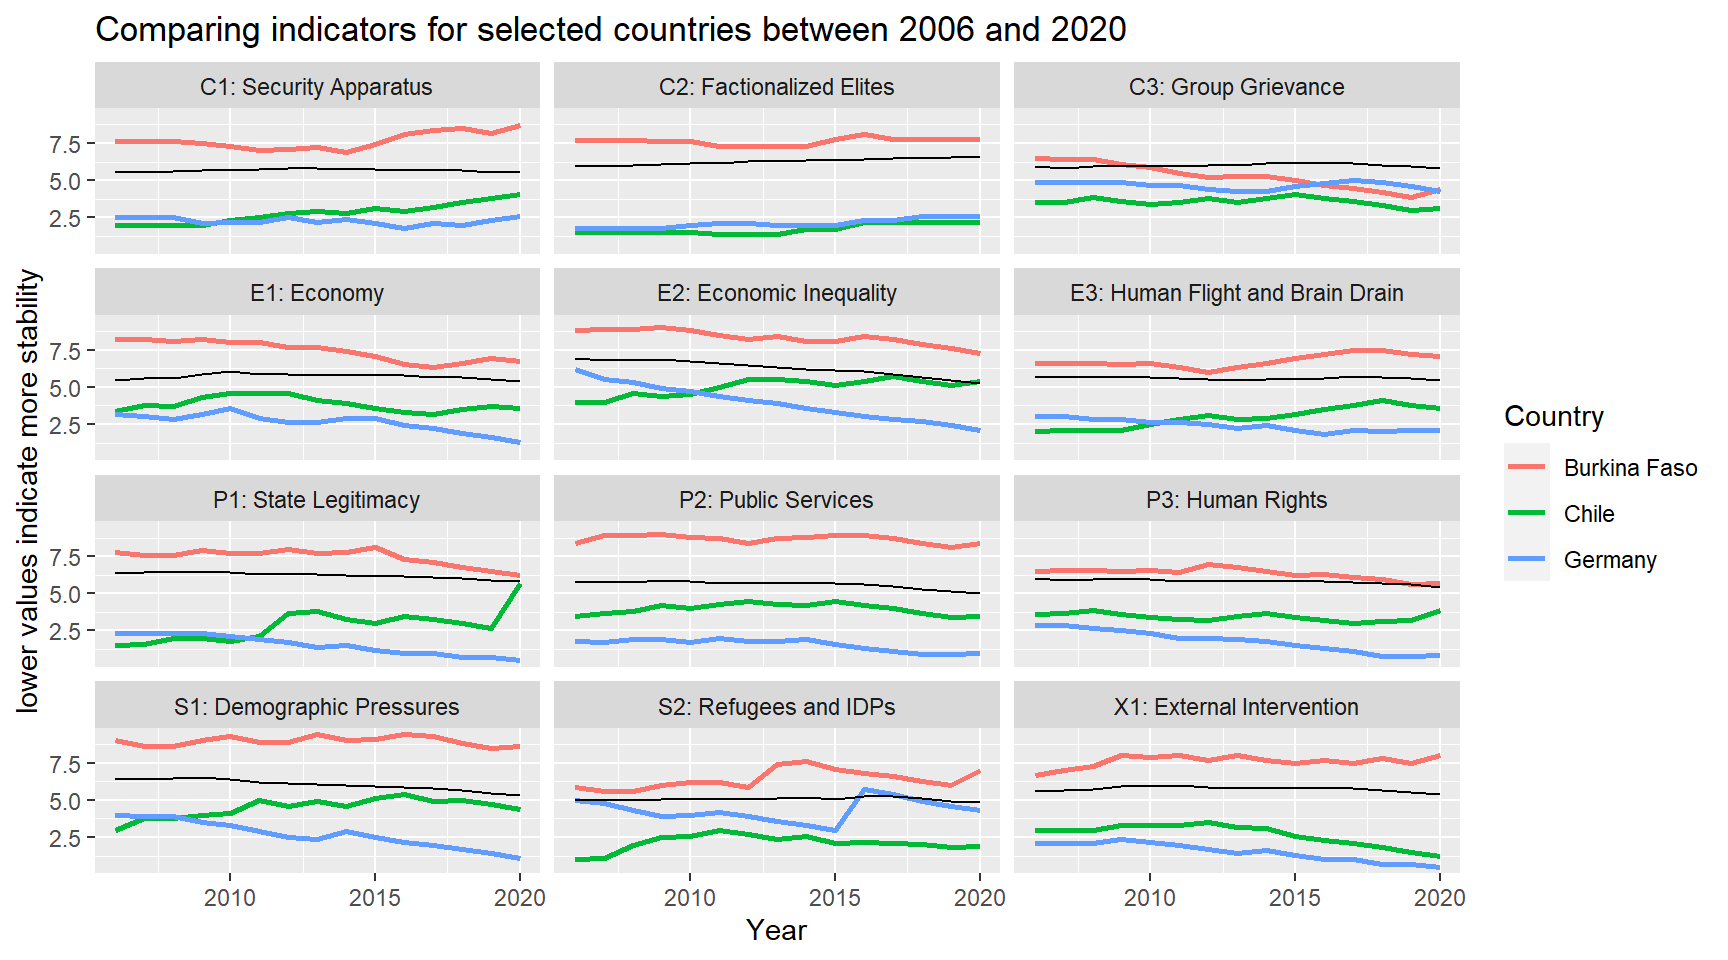
Similar to the first country comparison plot, we can see how the indicators evolve over time for different countries. Long-term trends and jumps in the indicators are worth a google search. In the interactive version you can also check other countries of your interest.
Final notes
In case of any questions or interest for discussion, feel free to reach out to me via mail (richard.vogg@web.de) or Twitter.
We live in a complex world. The work done by the Fragile State Index helps to understand in which areas countries are progressing. It is important to understand that despite of all the bad events and news that occur every day, progress and improvements are being made in many areas. (Side note: I recommend Hans Rosling’s book Factfulness which is related to this topic.)
Data analysis is one powerful tool to find and communicate patterns and information. It is much more powerful to combine this information with knowledge about political and economic events in certain countries. I highly recommend reading some of the articles on the website which tell the story behind the data for selected countries.
Creating the network was made super easy by David Robinson’s {widyr} package to calculate pairwise distances between the countries and Thomas Lin Pedersen’s {ggraph}.
The Fragile State Index data is freely available at their website. After downloading the documents, I used the following cleaning script in R to combine everything in one dataframe.
library(dplyr)
library(tidyr)
library(readxl)

df <- lapply(2006:2020,function(x) {
  read_xlsx(paste0("data/fsi-",x,".xlsx")) %>%
    select(1:16)
}) %>%
  do.call(rbind,.) %>%
  mutate(Year=format(Year,"%Y"))

df_long <- df %>%
  tidyr::pivot_longer(cols = `C1: Security Apparatus`:`X1: External Intervention`,
                      names_to="category")